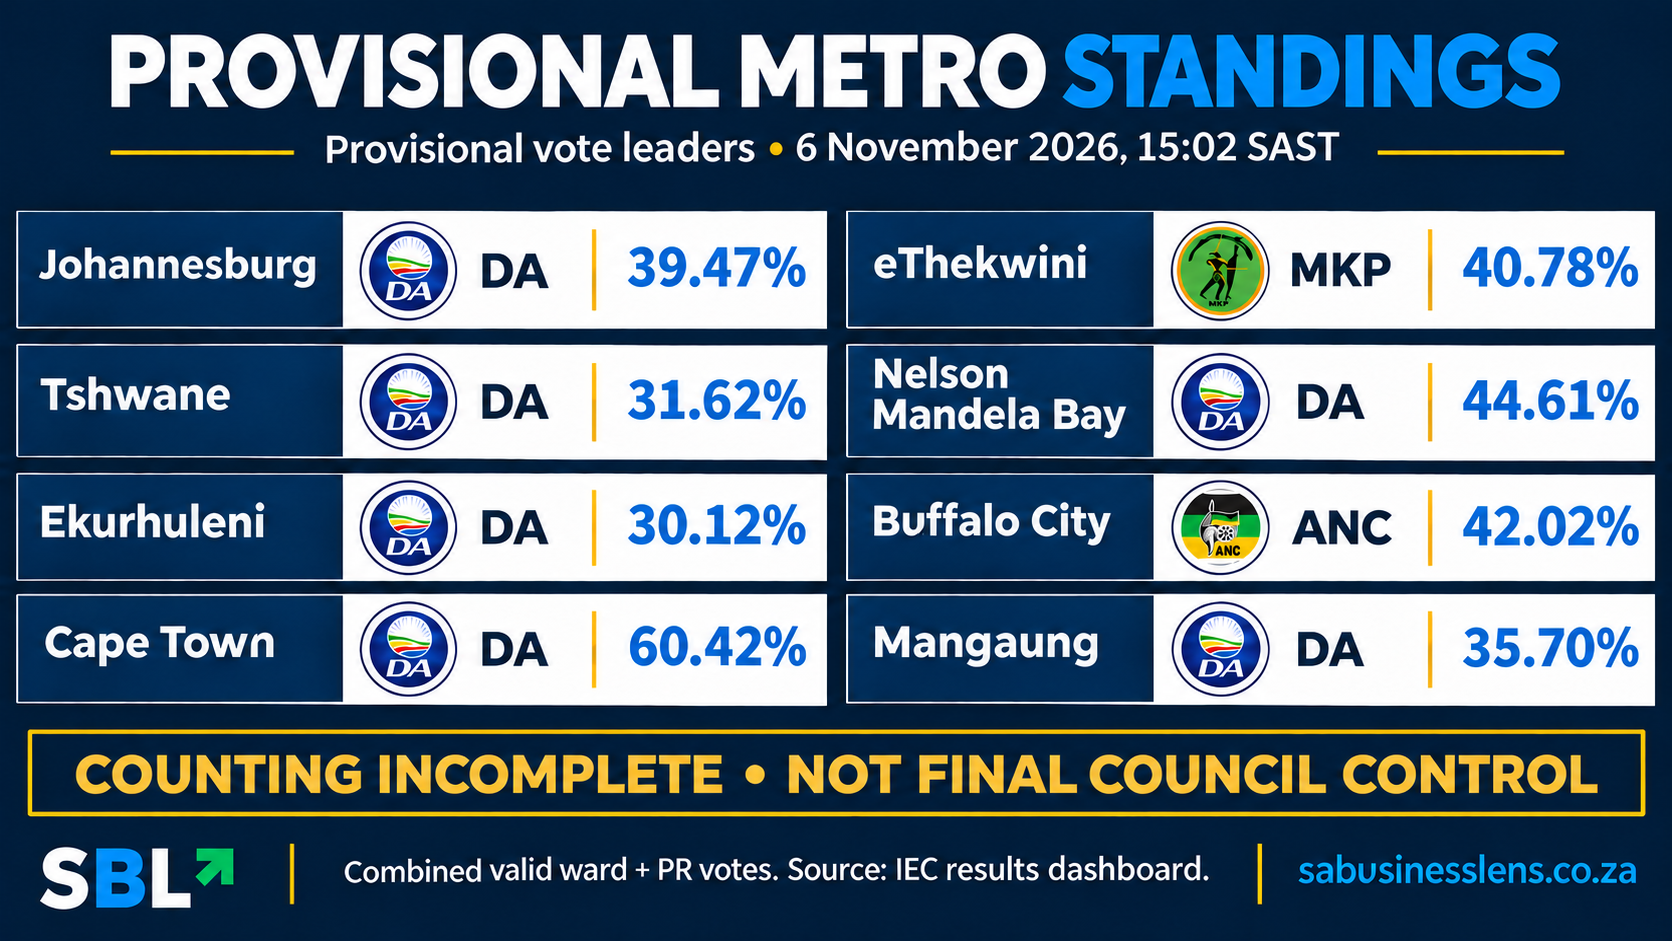
Counting remains incomplete, but the DA leads the combined ward and proportional-representation vote in six of South Africa’s eight metros in the IEC’s 15:02 SAST snapshot. The ANC leads Buffalo City and MKP leads eThekwini. These are provisional vote standings, not final council control.
Data snapshot: IEC national report at 15:02:23 SAST on 6 November 2026; individual metro records updated between 14:56:15 and 15:01:47 SAST. AI-assisted drafting and graphic production using IEC data. This is a fixed snapshot, not a live feed.
The Democratic Alliance leads the recorded combined vote in Johannesburg, Tshwane, Ekurhuleni, Cape Town, Nelson Mandela Bay and Mangaung in this snapshot.
uMkhonto weSizwe Party leads in eThekwini, while the ANC leads Buffalo City. All eight municipality-complete flags remain at zero. The figures below describe votes and partial ward results recorded so far, not final winners, confirmed majorities or the parties that will elect the next mayors.
Who is leading each major metro?
| Metro | Vote-leading party | Share of combined valid votes | Voting districts complete | Ward results recorded |
|---|---|---|---|---|
| Johannesburg | DA | 39.47% | 501 of 862 | 25 of 135 |
| Tshwane | DA | 31.62% | 616 of 796 | 49 of 107 |
| Ekurhuleni | DA | 30.12% | 469 of 653 | 33 of 112 |
| Cape Town | DA | 60.42% | 566 of 829 | 29 of 118 |
| eThekwini | MKP | 40.78% | 460 of 839 | 25 of 112 |
| Nelson Mandela Bay | DA | 44.61% | 240 of 268 | 40 of 60 |
| Buffalo City | ANC | 42.02% | 380 of 380 | 49 of 50 |
| Mangaung | DA | 35.70% | 324 of 388 | 29 of 51 |
Source: IEC municipal results dashboard and its national results data. Percentages are the IEC’s combined ward-plus-PR valid-vote shares. Completion figures count voting districts and recorded ward results; they are not the percentage of all votes counted. The snapshot is provisional and can be revised.
The Gauteng picture
The DA leads the recorded vote in Johannesburg, Tshwane and Ekurhuleni, but remains below 50% in each. Johannesburg has 501 of 862 voting districts complete in this snapshot, leaving a substantial portion of the district results outstanding.
These figures establish the current vote leaders. They do not establish the final seat distribution or which parties will work together in council.
Cape Town, eThekwini and the coastal metros
Cape Town has the largest leading-party share among the eight metros in this snapshot, with the DA at 60.42%. Counting remains incomplete there, with 566 of 829 voting districts complete and 29 of 118 ward results recorded.
In eThekwini, MKP leads at 40.78%, with 460 of 839 voting districts complete. The DA leads Nelson Mandela Bay at 44.61%, while the ANC leads Buffalo City at 42.02%.
Buffalo City has all 380 voting districts captured in this snapshot, but one ward result remains outstanding and the council outcome is not final. In Mangaung, the DA leads the combined vote at 35.70%, with 324 of 388 voting districts complete and 29 of 51 ward results recorded.
Why votes and council control are different
A metro has ward and proportional-representation ballots. Adding those ballots provides the dashboard’s overall support measure; it is not a count of individual voters, because a voter can cast both ballots.
The IEC’s seat display can tell a different story from its vote ranking while allocations remain incomplete. Partial ward-seat figures are not final council totals, and no final council control should be inferred from this snapshot.
For that reason, this article ranks parties by the IEC’s vote-leader flag and combined vote share, rather than treating a seat-based leading-party display as proof of who leads the vote.
What happens next?
The remaining results, verification and objections process can change the picture. The IEC cautioned at its 5 November briefing that station results remain provisional until formally declared. SBL’s earlier report explains the objections and declaration process.
For households and businesses, the eventual governing arrangements matter for municipal budgets and services. This snapshot does not predict tariff changes, service improvements or coalition agreements.
Sources and methodology
The primary source is the IEC’s 2026 national dashboard data, report timestamp 15:02:23 SAST on 6 November. Metro report timestamps range from 14:56:15 to 15:01:47 SAST. The table transcribes each metro’s vote-leading party, percentage of combined valid votes, completed/expected voting-district counts and recorded/expected ward results. The percentages were independently recalculated from the official combined ward and PR valid-vote totals. All municipality-complete flags remained at zero.
The ordinary dashboard’s metro drawer can prioritise partial seat leaders, which may differ from combined vote leaders. This article therefore distinguishes vote leadership, partial seats and governing control and does not convert partial ward seats into a final seat allocation.
The 5 November SAnews report of the IEC briefing supplies the provisional-results warning. No live national forecast, mayoral claim or historical comparison is included. Refresh the figures and imagery for any later update; this article records a timestamped snapshot, not an automatically updating results feed.
[…] 01Provisional election standings: DA leads votes in six metros as counting continues […]
[…] reading: SBL’s 6 November provisional metro standings. That snapshot is not a current results table. Our earlier Johannesburg mayoral-debate coverage […]