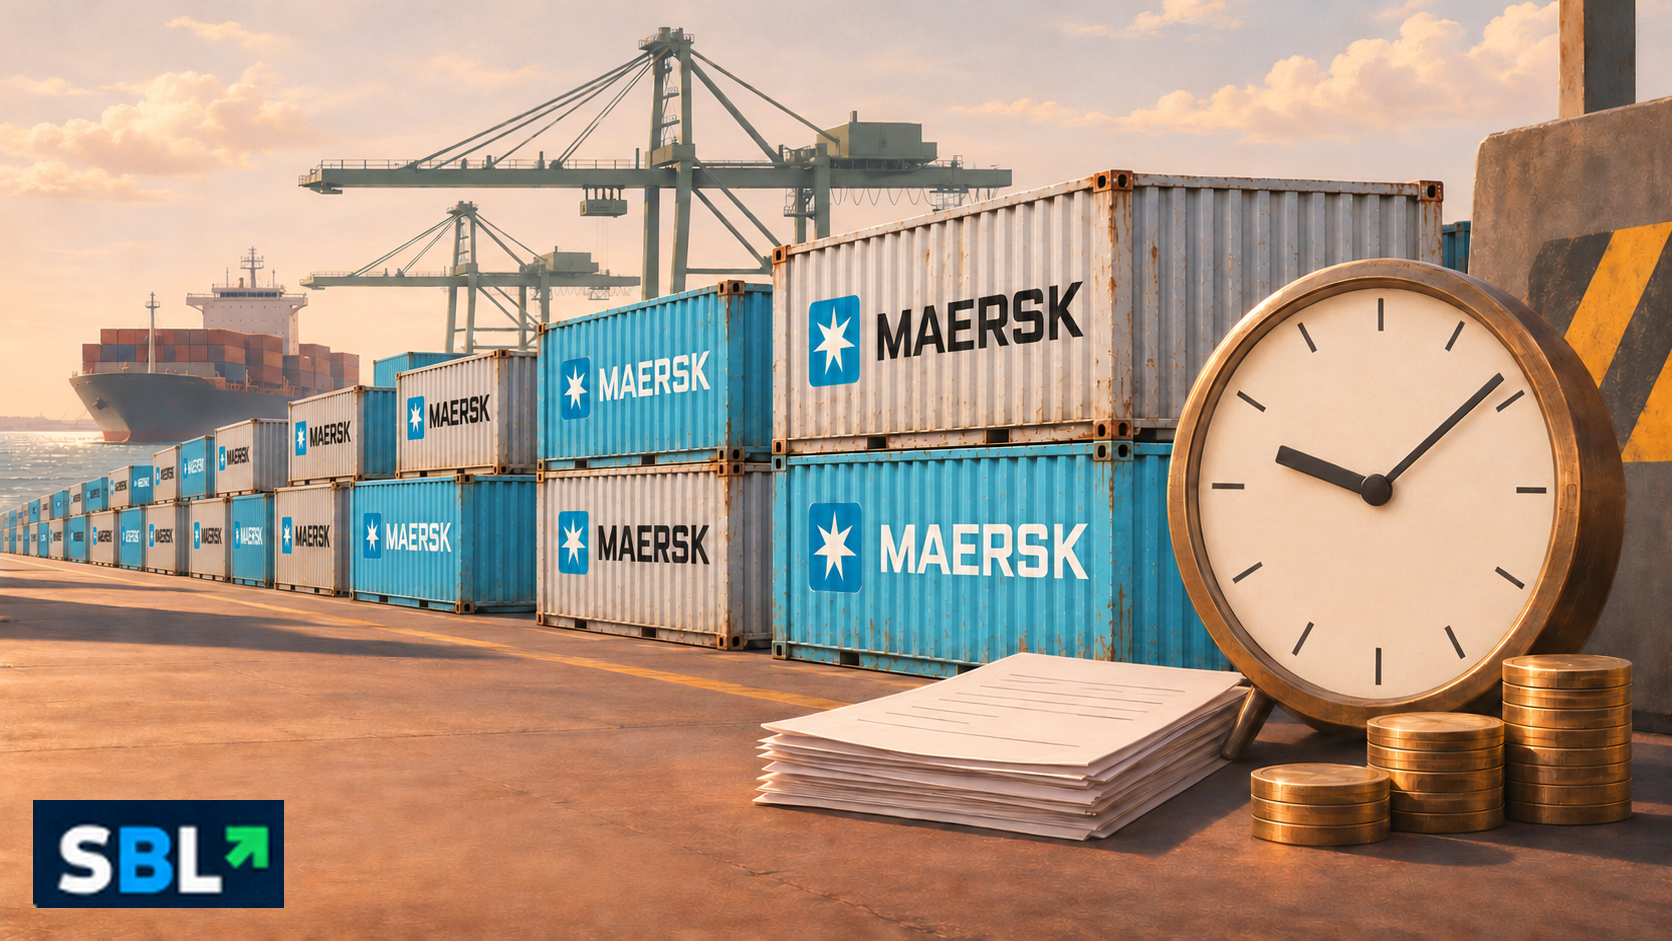
Editorial illustration of container delays and the cost of stock waiting to move.
A 40-foot container from China now carries a published Maersk Durban congestion surcharge of US$800, up from US$500 in its earlier tariff. For an importer, that US$300 increase is only one part of the budget. Goods waiting to move can also tie up cash and miss a selling window.
The latest notices show a mixed picture. Maersk’s specified congestion fees have increased by 60% or 80%, depending on origin. Some reported port delays have eased, while temporary detention relief gives customers extra time. The useful calculation starts with the particular shipment, rather than a single headline percentage.
What changed in the congestion fee?
Maersk’s 4 September notice listed US$250 per 20-foot container and US$500 per 40-foot container for the specified Far East Asian, Indian subcontinent and Middle Eastern origins. It expressly applied across Durban discharge terminals.
The 8 October revision introduced the following November rates. These are carrier congestion surcharges per container, not the total freight bill or a port-wide tariff charged by every shipping line.
| Origin and size | Earlier tariff | November tariff |
|---|---|---|
| China, 20-foot | US$250 | US$400 |
| China, 40-foot | US$500 | US$800 |
| Other listed origins, 20-foot | US$250 | US$450 |
| Other listed origins, 40-foot | US$500 | US$900 |
Sources: Maersk notices dated 4 September and 8 October 2026. “Other listed origins” means Far East Asia excluding China, the Indian subcontinent and Middle East within the notice’s scope.
The effective dates are 1 November for non-regulated countries and Vietnam, and 8 November for Korea and Taiwan. The October notice does not explicitly define the pricing-date trigger. Check the booking terms before assuming an arrival or invoice date determines the charge.
SBL’s comparison gives a 60% increase for China-origin cargo: (400 − 250) ÷ 250 × 100. For the other listed origins, (450 − 250) ÷ 250 × 100 gives 80%. The corresponding 40-foot calculations produce the same percentages.
What does that add to each item?
Take the US$300 increase on a 40-foot China-origin shipment. At an illustrative R18 per dollar, it adds R5,400. Spread across 1,000 saleable items, the increase is R5.40 each. Across 10,000 items, it is 54 cents.
These are simplified SBL calculations using a round exchange-rate assumption, not a current currency quote or an importer’s invoice. R5,400 is the modelled increase in one surcharge, not the shipment’s full cost.
Container utilisation matters because a fixed charge spreads differently across bulky furniture, small components and densely packed consumer goods. In a mixed container, equal allocation per item may be inappropriate. Use the business’s actual cargo mix and cost-allocation method.
Supplier terms matter too. Establish which charges the importer pays directly and which are already included in the agreed purchase price. Otherwise, a budget can count the same cost twice.
Another carrier has a different charge
Hapag-Lloyd has separately announced a US$500-per-TEU peak-season surcharge on listed routes from China, Korea and Japan to Durban and Cape Town. Its notice applies to cargo loaded aboard from 3 November 2026 until further notice, across container types.
A TEU is a twenty-foot equivalent unit. The stated basis implies US$500 for a standard 20-foot container and US$1,000 for a standard 40-foot container. This belongs to a separate carrier’s tariff. Comparing options requires complete quotes for the same cargo, route and dates; adding it to Maersk’s surcharge would create a fictitious bill.
The delay picture differs by terminal
Hapag-Lloyd’s 6 November operational update reported Durban Pier 1 delays of six to nine days and Pier 2, or Durban Gateway Terminal, delays of 12 to 14 days, subject to conditions.
Its 30 October update had put Pier 1 at 10 to 12 days and DGT at 12 to 14 days. The comparison suggests improvement at Pier 1 while the reported DGT range remained unchanged.
These are dated carrier snapshots, not a guaranteed delay for every vessel or an average across all importers. A vessel waiting for a berth and a container remaining after discharge also involve different clocks and contractual charges.
Cash tied up has a cost
Suppose a business finances R500,000 of stock at an assumed annual rate of 15%. Fourteen additional days would cost about R2,877 in simple interest: R500,000 × 15% × 14 ÷ 365. At seven days, the same assumptions produce about R1,438.
This is an illustrative financing scenario, not a quoted lending rate, an observed loss or a claim that every Durban shipment faces 14 extra days. It excludes lost sales, cancelled orders and markdowns if seasonal goods arrive late. Those effects depend on the product and business.
A higher-priced alternative route may therefore deserve consideration if its realistic delivery advantage outweighs the extra transport cost. The comparison should use the full cost and timing of each option, including onward delivery, rather than the ocean rate alone.
Temporary relief changes some budgets
Maersk’s 2 November notice increased import detention free time from four to five days across Durban discharge terminals, with immediate effect through 31 December. Its published plan is to return to four days from 1 January 2027.
Confirm the concession in the applicable terms, including when the clock starts. An extra detention-free day is not a blanket waiver of other charges.
Maersk also suspended its Durban–Cato Ridge drop-off fee from 11 September until further notice. The previous amounts were R4,200 per 20-foot container and R4,500 per 40-foot dry container. That relief belongs in the calculation only when the relevant drop-off arrangement applies, not as a deduction from every shipment’s congestion increase.
What businesses and households should watch
Before committing to an order or promotion, importers should obtain an itemised quote, the date governing each charge, the exact free-time entitlement and a delivery estimate allowing for onward transport. Recalculate per-item costs using the actual exchange rate and saleable quantity.
Maersk’s 9 November market update says port bottlenecks may increase demand for air imports during South Africa’s year-end peak. It identifies alternative and multimodal routings as options to assess. Availability and economics remain shipment-specific; faster transport may be unsuitable for bulky or low-margin goods.
For households, these notices show pressure on some import costs, rather than a measurable increase in shop prices. Existing inventory, exchange rates, supplier terms and retailer margins affect whether and when costs reach customers.
The next useful signals are updated terminal-delay reports, revised carrier tariffs and whether temporary relief continues beyond December. Separately, SBL’s Richards Bay road-upgrade coverage examines another freight bottleneck; it is not evidence about Durban’s current operating conditions.
For businesses pricing stock today, the defensible figure is the cost of their own shipment, allocated across goods they can actually sell.
Sources and calculation method
Tariff and operational dates are identified alongside their primary-source links. Percentage changes compare the published September and November Maersk congestion tariffs. Rand examples use R18/US$ only as an assumption. Per-item increases divide the converted surcharge change by the assumed saleable quantity. Financing examples use simple annual interest on a 365-day basis and round to the nearest rand. They are scenarios, not measured importer costs.



Leave a Reply