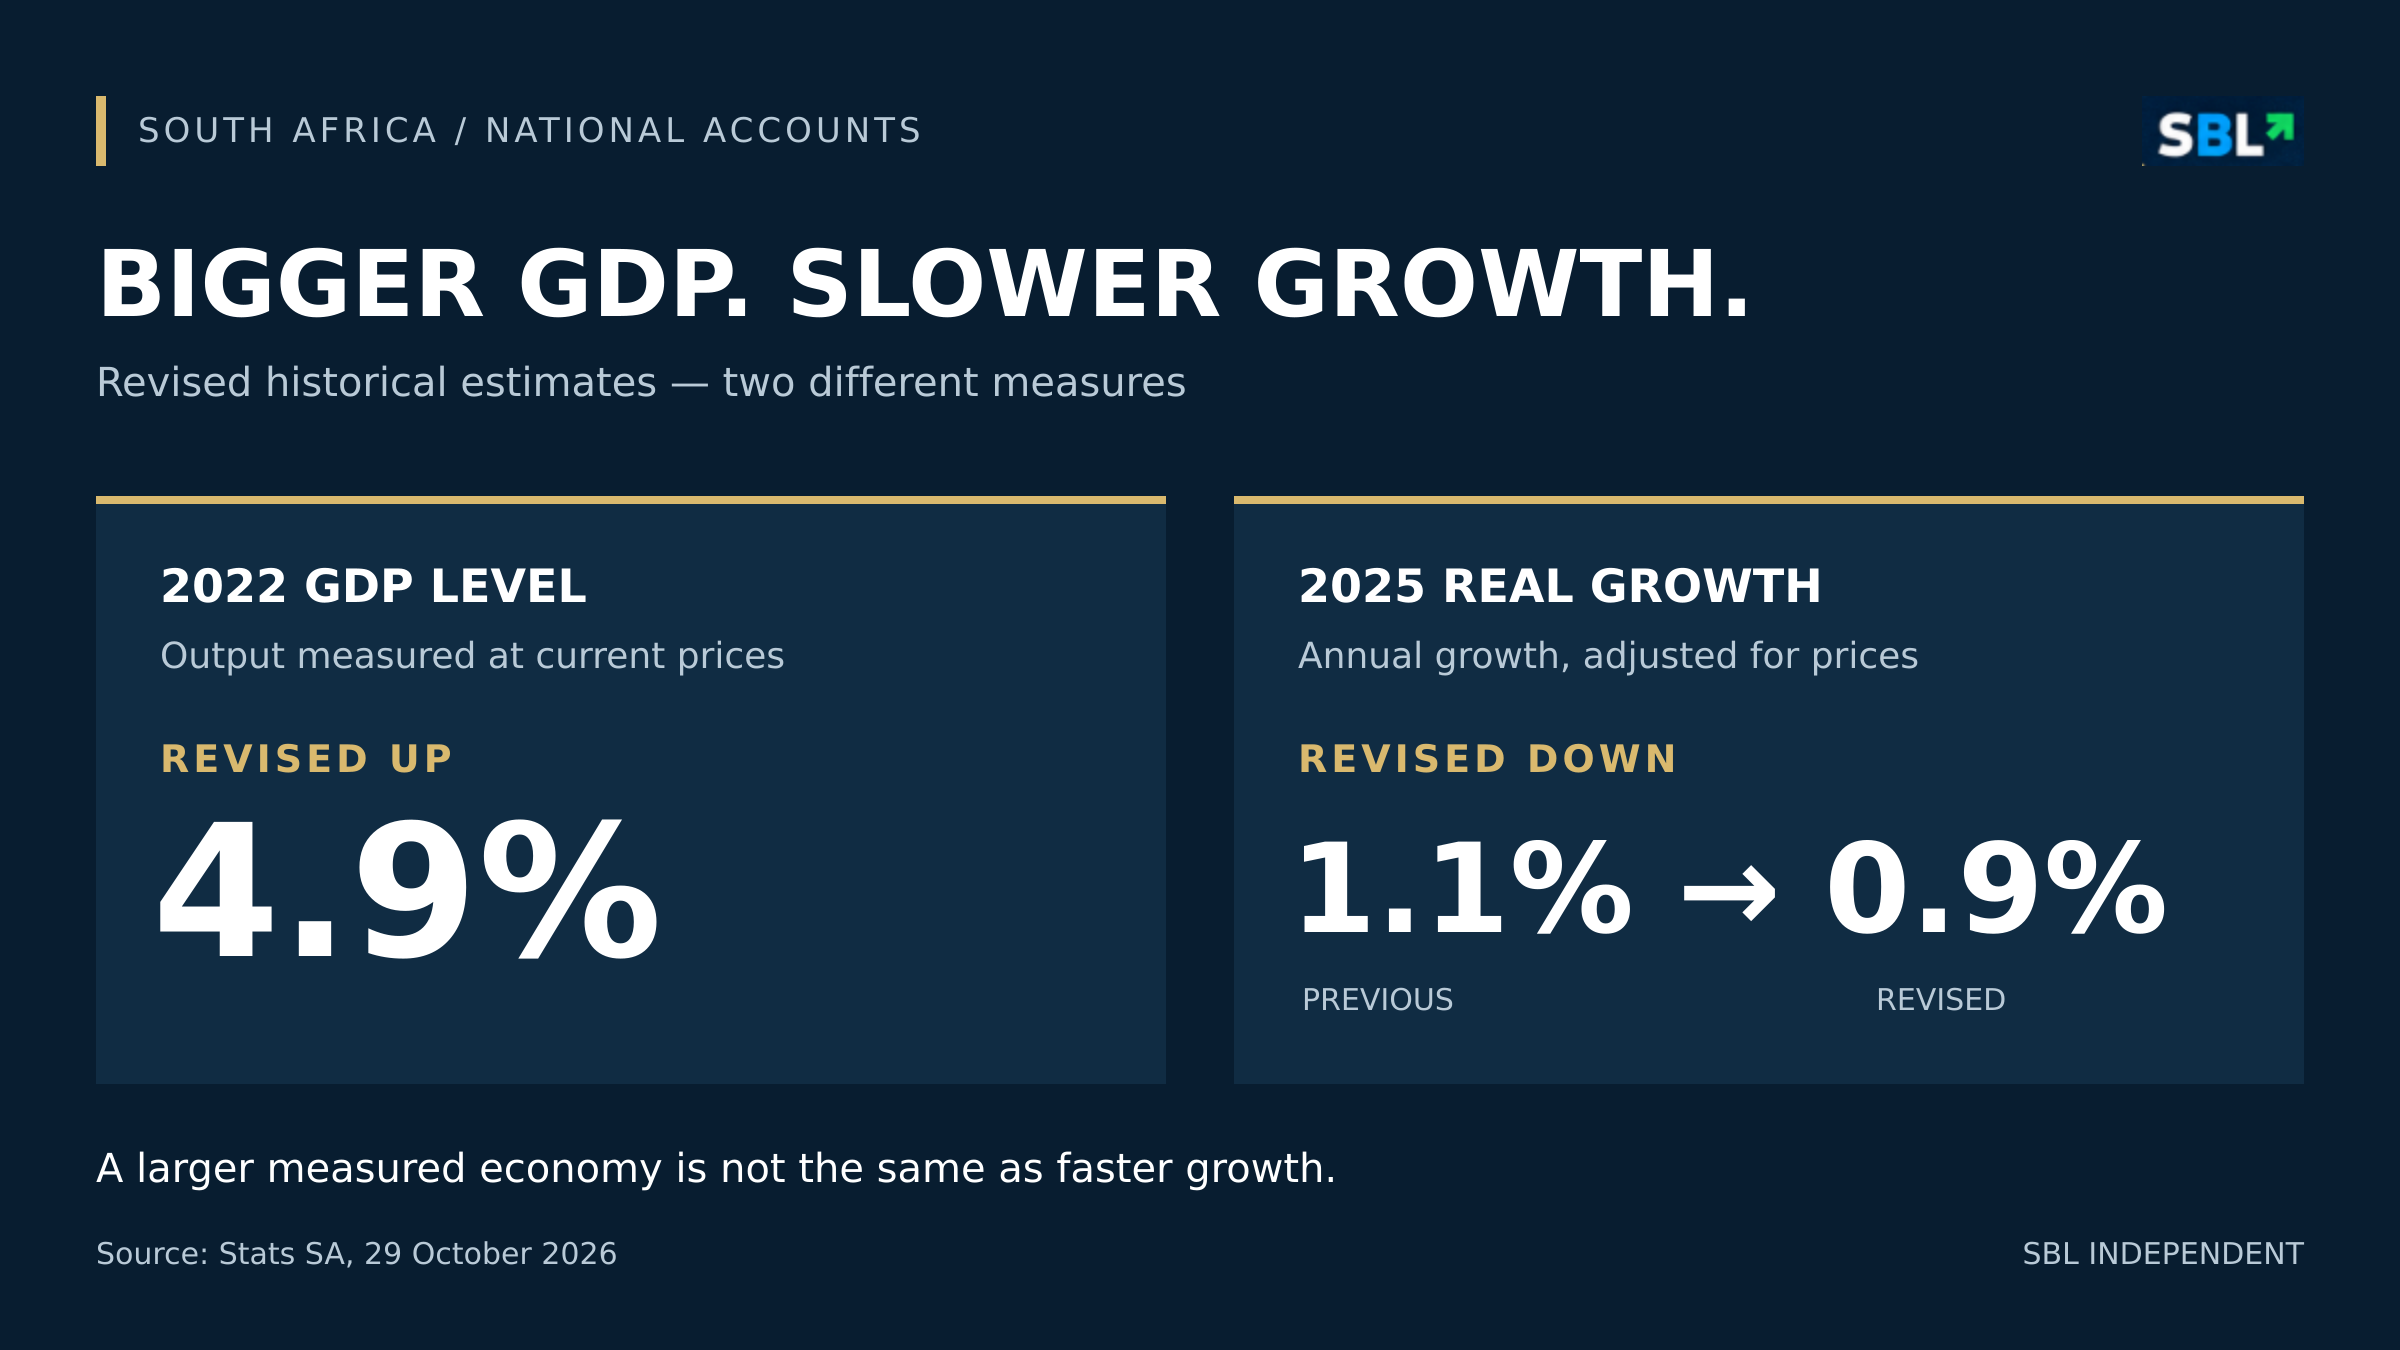
Stats SA’s new estimates put South Africa’s 2022 economic output higher than previously measured, while reducing the growth estimate for 2025 from 1.1% to 0.9%. The distinction matters for businesses: a larger measured market is not the same thing as faster-growing demand.
SBL Independent Articles | Published analysis
Prepared and sources last checked: 29 October 2026, 12:00 SAST. AI-assisted research and drafting. Sources were manually verified before publication.
Key findings
- The detailed 2022 current-price GDP estimate rose from R6,666.581 billion to R6,990.436 billion, an increase of R323.855 billion, or 4.9% when rounded.1
- Real growth in 2025 was revised down by 0.2 percentage points. The 2024 rate remained 0.5%.2
- These are revised measurements of past activity, not R323.855 billion of new spending arriving in October 2026. SBL’s analysis is that business plans should separate the changed size of the market from its growth rate.
Evidence: what changed today
Stats SA released its benchmarked and rebased national accounts on 29 October 2026 at 11:00 SAST. Its methods report distinguishes two changes: rebasing moves the constant-price reference year from 2015 to 2022; benchmarking incorporates updated data, classifications and methods. The new data include the 2022 census and the 2022/23 Income and Expenditure Survey.3
The difference is practical. Current-price GDP measures output valued at the prices of the period. Real growth tracks changes after accounting for price movements. A revision can raise the measured level of output while reducing the growth rate between years.
Recent annual growth rates before and after revision
| Calendar year | Previous real growth (%) | Revised real growth (%) | Change (percentage points) |
|---|---|---|---|
| 2022 | 2.1 | 2.2 | +0.1 |
| 2023 | 0.8 | 0.6 | -0.2 |
| 2024 | 0.5 | 0.5 | 0.0 |
| 2025 | 1.1 | 0.9 | -0.2 |
Source: Stats SA, Fact sheet A, released 29 October 2026. Previous series uses 2015 prices; revised series uses 2022 prices. These are revised historical estimates, not forecasts. Percentage-point changes are revised minus previous.2
The reset also changes what is measured within sectors. Stats SA attributes the 12.5% upward revision to mining’s 2022 level mainly to including and better covering illegal mining. It attributes the 9.1% revision to finance, real estate and business services primarily to improved owner-occupied housing estimates. Neither percentage measures those industries’ growth during 2026.4
SBL analysis: the market is larger, but the growth signal is weaker
The useful business question is not whether the headline number became bigger. It is which part of a company’s planning assumptions needs to change.
A supplier estimating the total size of a sector may need to update its market benchmark. A company deciding whether to hire, borrow or add capacity needs evidence of demand growth. The revised 2025 growth rate gives a more subdued picture than the previous estimate, even though the measured economy is larger.
That is not a contradiction. One number describes the estimated level of activity; the other describes how quickly activity changed. Treating the upward revision as an immediate sales opportunity would mix those two concepts.
Owner-occupied housing illustrates why GDP and cash are different. National accounts include an estimated housing service that homeowners provide to themselves, described as imputed rent. A revised estimate of that service is not an extra rent payment deposited into a homeowner’s bank account.3
Impact: who benefits, and what does it cost?
The immediate beneficiaries are users of economic data: businesses comparing markets, analysts testing investment assumptions and policymakers allocating resources. The World Bank explains that comprehensive revisions improve coverage and industry weights, but can create breaks in time series unless applied consistently to historical data.5
For a small business, the practical task is to replace old historical comparisons with a consistent revised series. Keep the vintage and reference year on spreadsheets; do not splice an old GDP level onto a new growth series without checking compatibility. That is a data-maintenance cost, not a new tax or regulatory charge announced in this release.
For households, the revision by itself does not raise wages, reduce prices or change a loan repayment. Those outcomes require changes in income, costs, lending terms or policy, not simply a revised estimate of past production.
Risks and limitations
Better measurement is valuable even when the growth revision is disappointing. Equally, national totals cannot establish the sales prospects of a particular firm or the financial position of an individual household.
There is a source inconsistency worth making visible. Fact sheet A’s rounded 2022 summary shows a R323 billion change and 4.8%. The detailed rand-million figures in Fact sheet B imply R323.855 billion and 4.8579%, which rounds to 4.9% and agrees with Stats SA’s press release. This article uses the detailed figures, rather than silently mixing the two summaries.124
SBL has not calculated a new government debt ratio or inferred extra budget spending room. Those questions require matching fiscal periods and an official reconciliation. Our earlier GDP-reset explainer covers that separate issue.
What happens next
Stats SA says the longer historical series extending back to 1993 will be made available in November 2026. Until then, users working with long-run comparisons should check which series and periods are available, rather than assuming that every historical dataset has already been replaced.4
The next useful test is how businesses, forecasters and public-finance analysts incorporate the revised history. A forecast built on the previous series should be labelled accordingly until its author updates it.
SBL bottom line
Today’s release improves the map of South Africa’s economy. It does not create a sudden improvement in trading conditions. For decision-makers, the clearest message is to use the larger measured level and the lower recent growth estimate together, instead of choosing whichever headline looks more encouraging.
Sources and methodology
This is original SBL analysis of primary statistical material, drafted with AI assistance. Sources were manually verified before publication. Prepared and sources last checked on 29 October 2026 at 12:00 SAST.
- Stats SA, Fact sheet B, 29 October 2026, page 1, Table 1. Values are in R million. Calculation: 6,990,436 – 6,666,581 = 323,855 million = R323.855 billion; 323,855 ÷ 6,666,581 × 100 = 4.8579%, rounded to 4.9%.
- Stats SA, Fact sheet A, 29 October 2026, page 1, real GDP growth table. Growth comparison uses the same calendar year in each published series.
- Stats SA, National Accounts Sources and Methods, Report 04-04-04, 29 October 2026, printed pages 2-3 and 87.
- Stats SA benchmarking and rebasing press release, 29 October 2026 at 11:00 SAST, pages 1-2 and 4.
- World Bank, Why do countries revise their national accounts?, accessed 29 October 2026.
Related reading: SBL’s administered-price inflation analysis examines a separate price measure and why its components matter.



Leave a Reply